
How Cloudflare Built an Intelligent Maintenance Scheduler using Workers
Cloudflare uses graphs, caching, and real-time analytics to automate maintenance scheduling and prevent infrastructure conflicts at scale.
When you think about running maintenance on a global network sounds simple, take a router offline, perform the upgrade, and bring it back online. But at Cloudflare's scale, with a network spanning more than 330 cities, even routine maintenance can have unexpected consequences.
For example, taking multiple edge routers or customer-specific data centers offline at the same time could impact connectivity or increase latency. As the network grew, manually tracking these dependencies and coordinating maintenance became increasingly difficult.
To solve this, Cloudflare built an intelligent maintenance scheduler on Cloudflare Workers. Instead of evaluating maintenance requests in isolation, it understands infrastructure relationships, checks for potential conflicts, and ensures maintenance can be carried out without affecting customer availability. Let's see how they built it in this blog today.
Why Maintenance Scheduling Became Difficult
Maintaining infrastructure isn't just about deciding whether a server or router can be taken offline. The real challenge is understanding how different parts of the network depend on one another.
Consider a group of edge routers serving multiple data centers within the same metropolitan area. Although these routers provide redundancy, taking all of them offline simultaneously could disconnect several data centers from the Internet.
Similarly, customers using Cloudflare's Dedicated CDN Egress IPs (formerly Aegis) route their traffic through specific Cloudflare data centers. If all of those data centers undergo maintenance at the same time, customer traffic could experience higher latency or even service disruptions.
While each maintenance request may seem safe on its own, overlapping maintenance windows can violate these operational guarantees, making manual coordination increasingly difficult.
From Manual Checks to Automated Decisions
To solve this, Cloudflare introduced the concept of a centralized maintenance scheduler. Whenever a maintenance request is submitted, the scheduler evaluates it before approval.
Instead of only checking the requested machines, it also examines other maintenance events that overlap during the same time window. More importantly, it evaluates how those events interact with infrastructure dependencies and customer configurations across the network.
If the proposed maintenance violates any operational rule, for example, leaving an entire router group unavailable or taking all data centers in an Aegis pool offline simultaneously, the scheduler alerts operators and recommends scheduling the maintenance at a different time.
This allows Cloudflare to detect conflicts before they ever impact production systems.
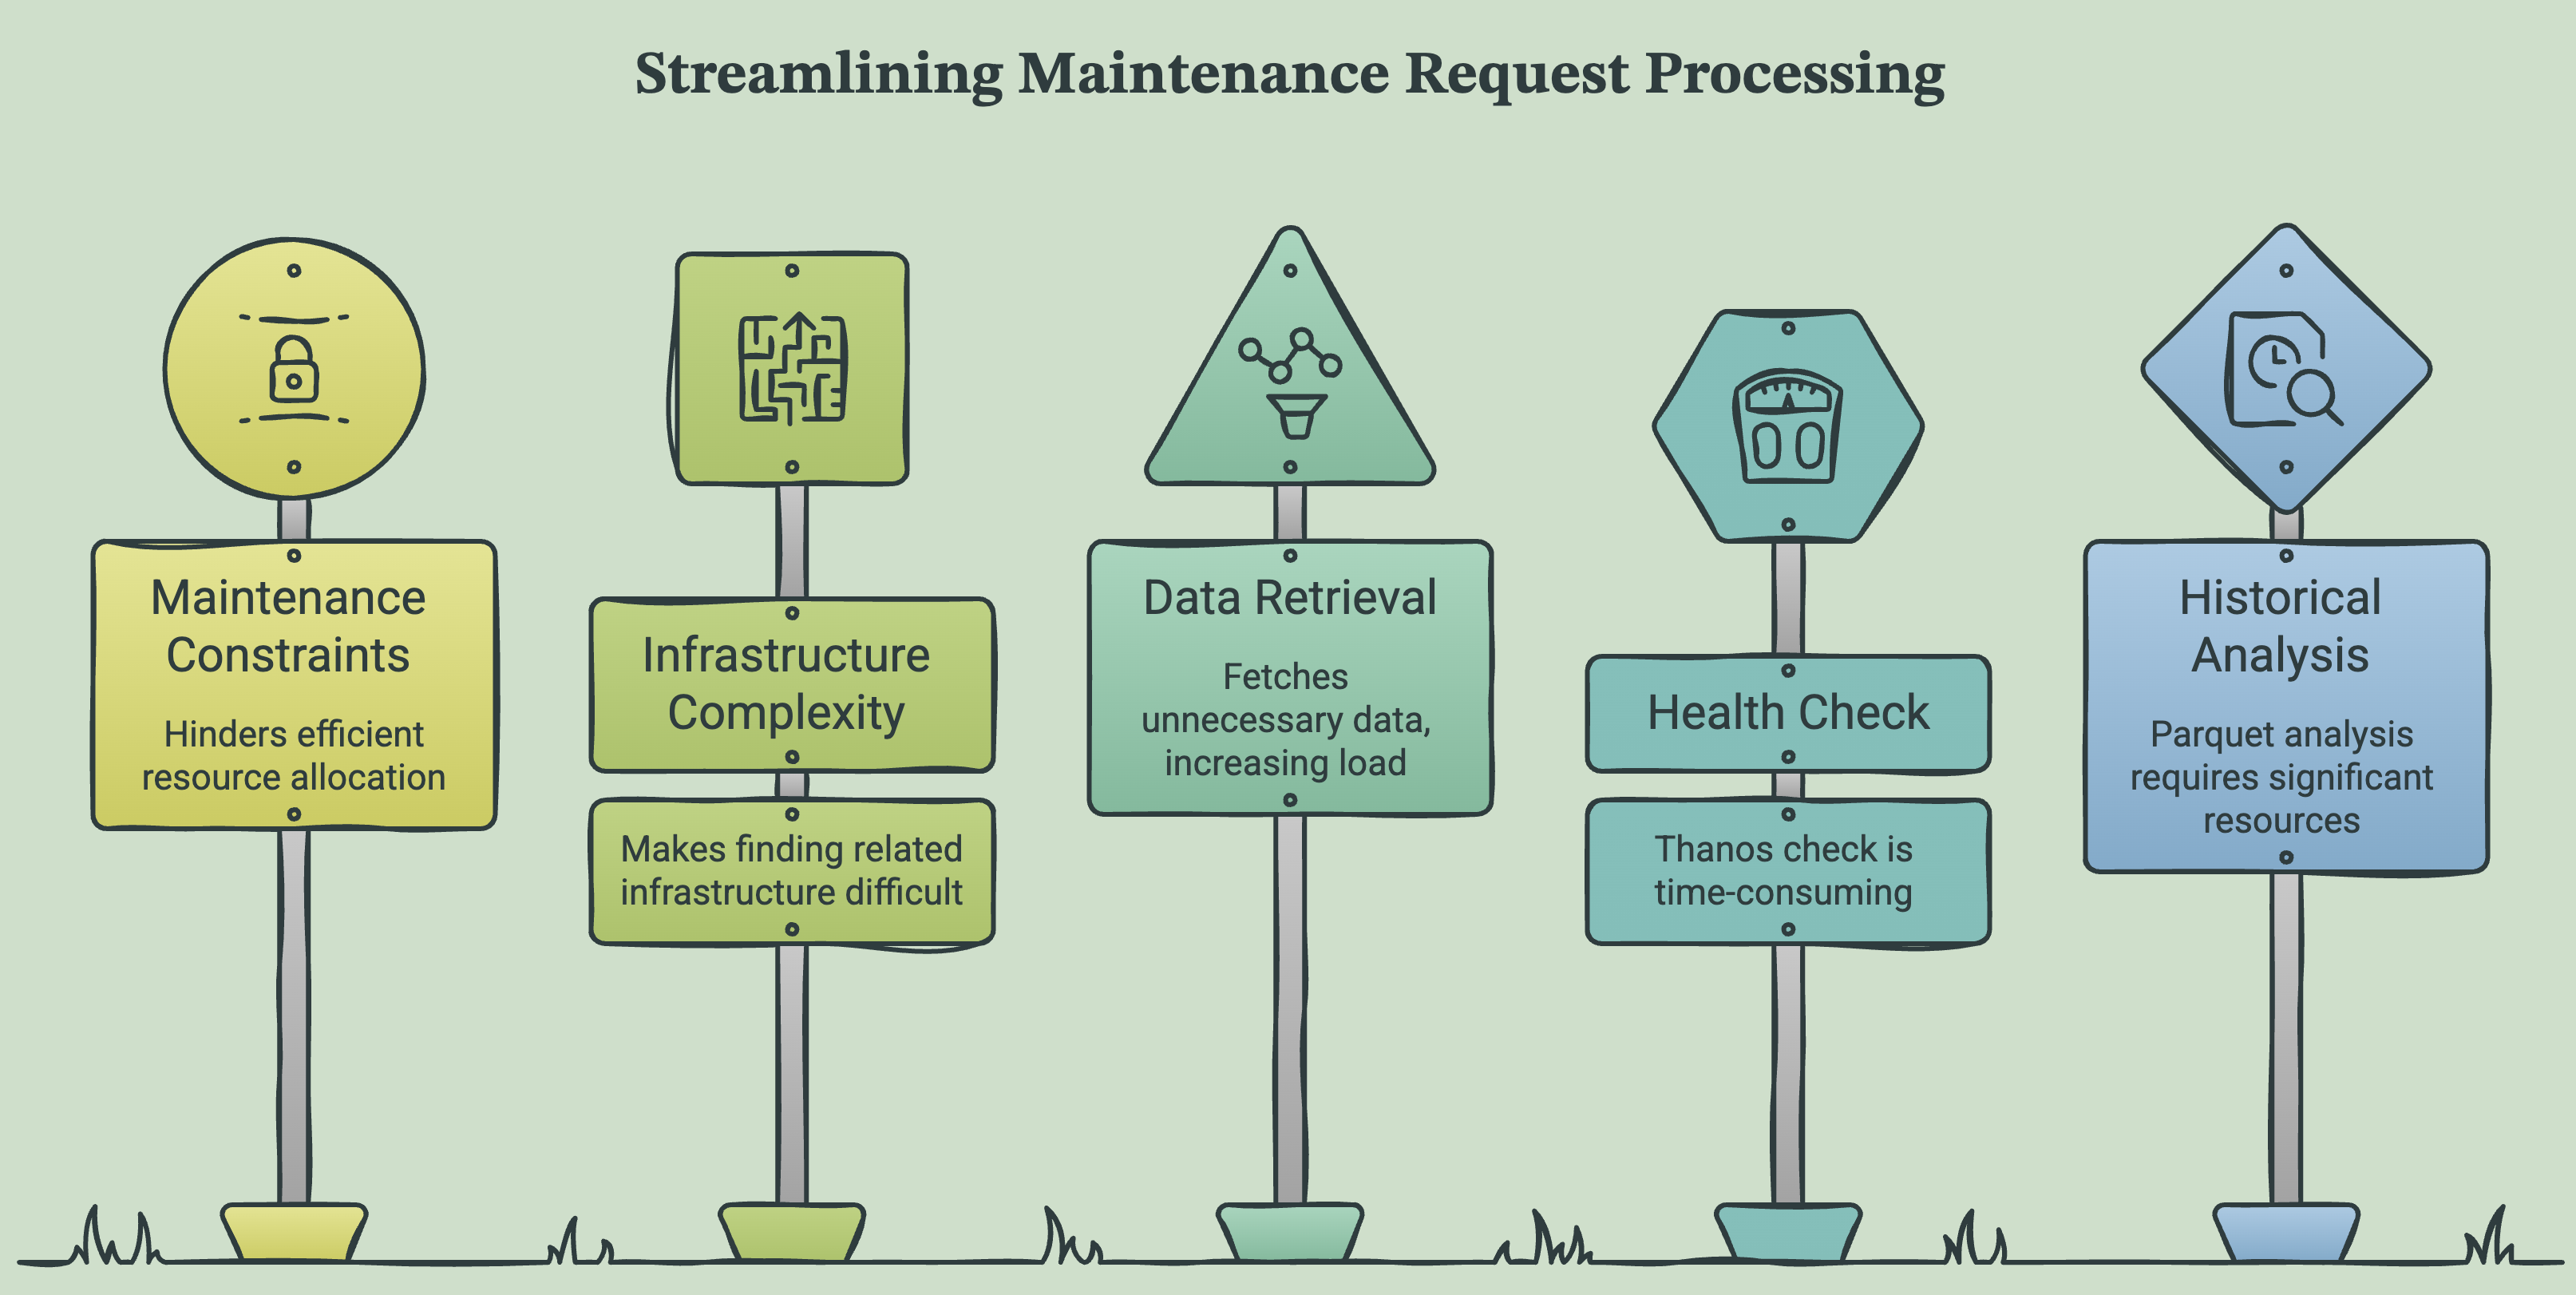
Defining Maintenance Constraints
At the heart of the scheduler is the idea of maintenance constraints. A maintenance constraint represents a rule that must always remain true, regardless of how many maintenance operations are happening simultaneously.
For example:
At least one edge router in a region should always remain operational.
Every Aegis customer pool should always have at least one available data center.
When a maintenance request arrives, the scheduler first identifies the infrastructure involved and retrieves all overlapping maintenance events from the maintenance calendar.
However, checking scheduled events alone isn't enough. The scheduler also needs to understand how the affected infrastructure relates to customers, products, and other infrastructure components before deciding whether the maintenance is safe.
Understanding Relationships Instead of Individual Systems
Imagine an Aegis customer whose traffic exits through Data Center 21 and Data Center 45. Viewed independently, these appear to be two unrelated data centers.
From the customer's perspective, however, they are part of the same service. As long as one remains available, traffic continues flowing normally. But if both become unavailable at the same time, the customer loses all configured egress locations.
This means the scheduler cannot evaluate maintenance requests by looking at individual machines alone. Instead, it must understand how infrastructure components are connected and how taking one system offline affects the others.
As more products introduced their own dependencies, these relationships became too complex to manage manually.
The First Implementation Didn't Scale
Cloudflare's initial approach was fairly straightforward. Whenever a maintenance request arrived, a single Worker loaded everything it might need:
Infrastructure relationships
Product configurations
Customer mappings
Health metrics
Once all of this information was loaded into memory, the business logic determined which parts were actually relevant to the maintenance request. While this worked for smaller datasets, it quickly became impractical.
Even during the proof-of-concept stage, Workers began running into out-of-memory errors because they were loading significantly more data than was actually required to evaluate a single maintenance request.
Loading Less Data Wasn't an Optimization, it Was a Requirement
The team realized they were solving the problem backwards. Instead of loading everything first and filtering later, why not fetch only the information that was actually needed?
For example, if a maintenance request involves a router in Frankfurt, the scheduler doesn't need information about infrastructure in Australia because there is no relationship between those systems.
Rather than treating every maintenance request as a global query, the scheduler should retrieve only the subset of infrastructure directly connected to that request.
This simple observation fundamentally changed the design of the system.
Modeling the Network as a Graph
As engineers examined different maintenance constraints, they noticed that every rule followed the same pattern.
There were objects, such as routers, data centers, or customer pools. Then there were relationships connecting those objects. This naturally mapped to a graph.
In this model:
A router becomes a node.
A data center becomes another node.
An Aegis pool becomes another node.
The relationships between them become graph edges.
Instead of searching through massive datasets, the scheduler can simply traverse the graph to discover only the infrastructure related to the maintenance request.
Building a Graph-Based View of the Network
To support this approach, Cloudflare built a graph interface inspired by Meta's TAO architecture. One of its key ideas is that every relationship has a type.
For example, the scheduler can ask:
Which Aegis pools contain this data center?
Which data centers belong to this Aegis pool?
Although these queries move in opposite directions, they're simply different relationship types within the same graph. This abstraction keeps the business logic simple while allowing the underlying graph implementation to decide the most efficient way to retrieve data.
Instead of loading every customer pool into memory and filtering it locally, the scheduler requests only the specific relationships required for the current maintenance request.

The overall decision-making flow looks something like this
Why Graphs Changed Everything
The biggest advantage of introducing the graph isn't just reducing memory usage. It fundamentally changes how the scheduler interacts with Cloudflare's infrastructure.
Rather than relying on large datasets that need to be filtered inside the application, the scheduler retrieves only the information that is directly relevant to the maintenance being evaluated.
This not only reduces memory consumption but also creates a clean separation between business logic and data retrieval. As Cloudflare's infrastructure grows, the graph implementation can continue improving query performance without requiring changes to the maintenance rules themselves.
That flexibility becomes even more important in the next stage of the system.
While the graph dramatically reduces the amount of data being loaded, it also introduces a new challenge, retrieving that data efficiently without overwhelming the platform with thousands of tiny requests.
Building a Smarter Fetch Pipeline for Data Retrieval
Moving to a graph-based architecture solved the memory problem by ensuring that the scheduler fetched only the data relevant to a maintenance request. However, it also introduced a new challenge.
Instead of making a few large API requests, the scheduler was now making thousands of much smaller ones. While each request carried significantly less data, the sheer number of requests quickly pushed the application towards Cloudflare Workers' subrequest limits.
In other words, the problem had shifted from how much data was being fetched to how efficiently those requests were being made.
To solve this, Cloudflare introduced a middleware-based fetch pipeline between the graph layer and the Fetch API.

Here's how the fetch pipeline processes every request before it reaches the backend
1. Eliminating Duplicate Requests
The first optimization focused on eliminating duplicate network calls.
During the execution of a maintenance check, it's common for different parts of the scheduler to request the same piece of information simultaneously. Without any optimization, each of these would trigger an identical HTTP request, wasting both network bandwidth and compute resources.
To avoid this, Cloudflare implemented request deduplication inspired by Go's singleflight package. If multiple requests ask for the same resource at the same time, only one request is sent to the backend while the others simply wait for its response.
This small optimization significantly reduced unnecessary traffic without requiring any changes to the scheduler's business logic.
2. Using Multiple Layers of Caching
After removing duplicate requests, the next step was to avoid making network calls whenever possible. Cloudflare introduced multiple layers of caching.
The first layer is an in-memory Least Recently Used (LRU) cache inside the Worker itself. Frequently accessed data can be served directly from memory without contacting downstream services.
If the requested data isn't available there, the scheduler checks Cloudflare's edge cache using caches.default.match. Since Workers execute on Cloudflare's global network, this allows cached responses to be served directly from nearby edge locations instead of repeatedly querying backend systems.
Different datasets are cached for different durations based on how frequently they change. Real-time information is cached for only about a minute, while relatively static infrastructure data can remain cached for several hours. Configuration data that changes infrequently can be cached even longer.
This approach balances two competing goals: keeping data fresh while minimizing unnecessary requests to origin services.
4. Handling Temporary Failures Gracefully
Distributed systems inevitably experience temporary failures. Backend services may become slow, return errors, or experience brief outages. Continuously retrying failed requests immediately would only increase pressure on already struggling services.
To avoid this, the fetch pipeline includes automatic retries with exponential backoff and jitter.
Instead of repeatedly sending requests as fast as possible, the scheduler waits progressively longer between retries while introducing small random delays. This improves the chances of a successful retry and prevents the system from overwhelming downstream services during periods of instability.
A 99% Cache Hit Rate
Together, request deduplication, layered caching, and intelligent retries dramatically improved the efficiency of the scheduler.
Cloudflare achieved an average 99% cache hit rate, meaning that almost every request could be served directly from cache instead of reaching backend systems.
This reduced latency, lowered infrastructure costs, and allowed the scheduler to make maintenance decisions much faster while generating significantly less load on internal services.
Making Decisions with Real-Time Data
Knowing how infrastructure components are connected is only one part of the problem. The scheduler also needs to know their current health.
For example:
Is an edge router already experiencing issues?
Has another router in the same region recently failed?
Is the surrounding infrastructure operating normally?
To answer these questions, Cloudflare relies on Thanos, its distributed Prometheus query engine, which provides real-time infrastructure metrics. Initially, the scheduler queried the health of every edge router and then filtered the results locally.
Although functional, this approach was inefficient. Responses often contained several megabytes of data, most of which was discarded after parsing.
Querying Only What Matters
The graph abstraction solved this problem as well. Instead of requesting metrics for every router, the scheduler first uses the graph to identify only the infrastructure related to the maintenance request. It then asks Thanos for metrics corresponding to just those components.
This reduced typical response sizes from multiple megabytes to roughly one kilobyte, around 1,000× smaller than before.
Besides reducing network bandwidth, smaller responses also lowered CPU usage because the Worker no longer needed to parse large JSON payloads containing mostly irrelevant information.
Why Historical Data Matters
Real-time metrics help determine whether maintenance is safe right now. But they don't explain whether similar maintenance operations have caused problems in the past.
Historical data is equally important.
Cloudflare uses past maintenance events to validate its scheduling logic, understand long-term trends, and ensure that operational constraints remain effective as the network continues to grow.
Analyzing months of historical data, however, introduces a very different performance challenge.
Making Historical Queries Faster with Apache Parquet
Historical metrics are stored using Prometheus TSDB blocks.
While this storage format performs well on local SSDs, it relies heavily on random reads, making it much less efficient when the data is stored in object storage such as R2.
To improve query performance, Cloudflare introduced a conversion layer that rewrites these TSDB blocks into Apache Parquet files.
Unlike row-based storage formats, Parquet stores data in columns along with rich metadata about each column. This allows the scheduler to read only the specific columns required for a query instead of scanning entire datasets.
Because Parquet files are immutable, Cloudflare can also cache them aggressively across its CDN, making repeated historical queries significantly faster.
The result was impressive: historical queries achieved up to 15× better P90 performance compared to the previous implementation.
How Everything Fits Together
The maintenance scheduler is much more than a tool for approving maintenance requests.
When a request is submitted, it first discovers the relevant infrastructure using the graph layer. It then retrieves only the necessary product relationships, infrastructure metadata, and real-time health information through the optimized fetch pipeline. Historical metrics are analyzed to validate long-term operational behavior, and all of this information is evaluated against the defined maintenance constraints before a decision is made.
By combining graph processing, intelligent request optimization, real-time observability, and historical analysis, Cloudflare transformed maintenance scheduling from a manual coordination process into an automated system capable of making safe, data-driven decisions across one of the world's largest networks.
Takeaways
As Cloudflare's global network expanded, manually coordinating maintenance became increasingly difficult due to the growing number of infrastructure dependencies and customer-specific routing rules.
Modeling infrastructure as a graph allowed the scheduler to retrieve only the data relevant to each maintenance request, significantly reducing memory usage and improving scalability.
A smart fetch pipeline with request deduplication, layered caching, and retries enabled efficient data retrieval while achieving a 99% cache hit rate.
Combining real-time metrics from Thanos with historical analysis using Apache Parquet allowed the scheduler to make faster and more reliable maintenance decisions.
The biggest lesson is that solving large-scale operational problems isn't just about automation. it's about building systems that understand relationships, efficiently retrieve data, and enforce safety constraints before changes reach production.
Official blog from Cloudflare: How Workers powers our internal maintenance scheduling pipeline
By now, you must have had a clear idea of, How Cloudflare Built an Intelligent Maintenance Scheduler with Workers? In a nutshell, Cloudflare built an intelligent maintenance scheduler that understands infrastructure dependencies before approving maintenance operations. By combining graph modeling, smart data retrieval, and real-time analytics, it prevents maintenance conflicts at a global scale.
Congratulations! You've just advanced another step in your tech journey. Keep progressing!