Essay
How Netflix Built a Real-Time Distributed Graph to Connect Billions of Member Interactions
Netflix built a Real-Time Distributed Graph using Kafka and Flink to connect member interactions across devices in near real time.
Think about how you use Netflix.
You might start watching Stranger Things on your phone while commuting, continue the same episode later on your smart TV, and eventually open a Stranger Things mobile game on your tablet. To you, these feel like separate activities happening across different devices. To Netflix, however, they're all connected.
Understanding these relationships helps Netflix build better recommendations, analyze how members interact with different products, and create more personalized experiences. But connecting these interactions in real time isn't as easy as it sounds.
As Netflix expanded beyond streaming into areas like ad-supported plans, live events, and mobile games, member interactions started spanning multiple products and services. The company needed a way to understand these relationships almost instantly instead of waiting for them to be processed later in a data warehouse.
This led Netflix to build a Real-Time Distributed Graph (RDG), a system designed to continuously connect member activities as they happen and make those relationships available for real-time analysis.
Let's understand why Netflix needed this system and how the first stage of its architecture processes millions of events every second in this blog today.
Why Traditional Data Processing Wasn't Enough
Imagine the example again.
A member watches Stranger Things on their phone, later continues watching on their TV, and finally plays a related Netflix game on their tablet. Although all these activities belong to the same member, they don't necessarily come from the same system.
In a traditional data warehouse, these events may be stored in different tables and processed at different times. Connecting them later requires joining data from multiple sources, which introduces delays before meaningful insights can be generated.
For a company operating at Netflix's scale, waiting for batch processing wasn't always enough. The goal was to identify relationships between these events as they occurred, allowing downstream systems to work with fresh, connected data instead of isolated records.
Why Microservices Created Another Challenge
Netflix is well known for its microservices architecture. Different teams build and maintain hundreds of independent services, with each service focusing on a specific business capability.
This approach offers several advantages. Each service can be developed, deployed, and scaled independently. It also manages its own data, allowing teams to choose the storage technologies and schemas that best fit their needs.
However, this also introduced a new challenge. Since every service owns its own data, information naturally becomes distributed across many independent systems. For data engineers and data scientists, answering questions that span multiple services meant manually combining data from warehouses and different databases. As Netflix expanded into new business areas, this process became increasingly difficult.
The challenge wasn't collecting data. It was connecting related pieces of data that lived in different places.
Why Netflix Chose a Graph
Netflix considered different ways of organizing this data before deciding on a graph-based model. Unlike traditional tables, graphs are built around entities and the relationships between them. In Netflix's case, entities could include members, movies, TV shows, devices, or games. The interactions between these entities become relationships inside the graph.
This approach offered several advantages.
First, graphs make it much easier to explore relationships across multiple connected entities without performing expensive joins that are common in relational databases.
Second, graphs are flexible. As Netflix introduces new products, devices, or interaction types, new relationships can be added without significantly redesigning the overall data model.
Finally, many of Netflix's internal use cases involve discovering hidden connections, groups, and interaction patterns, problems that naturally fit a graph representation. This became the foundation of Netflix's Real-Time Distributed Graph (RDG).
A High-Level View of the RDG
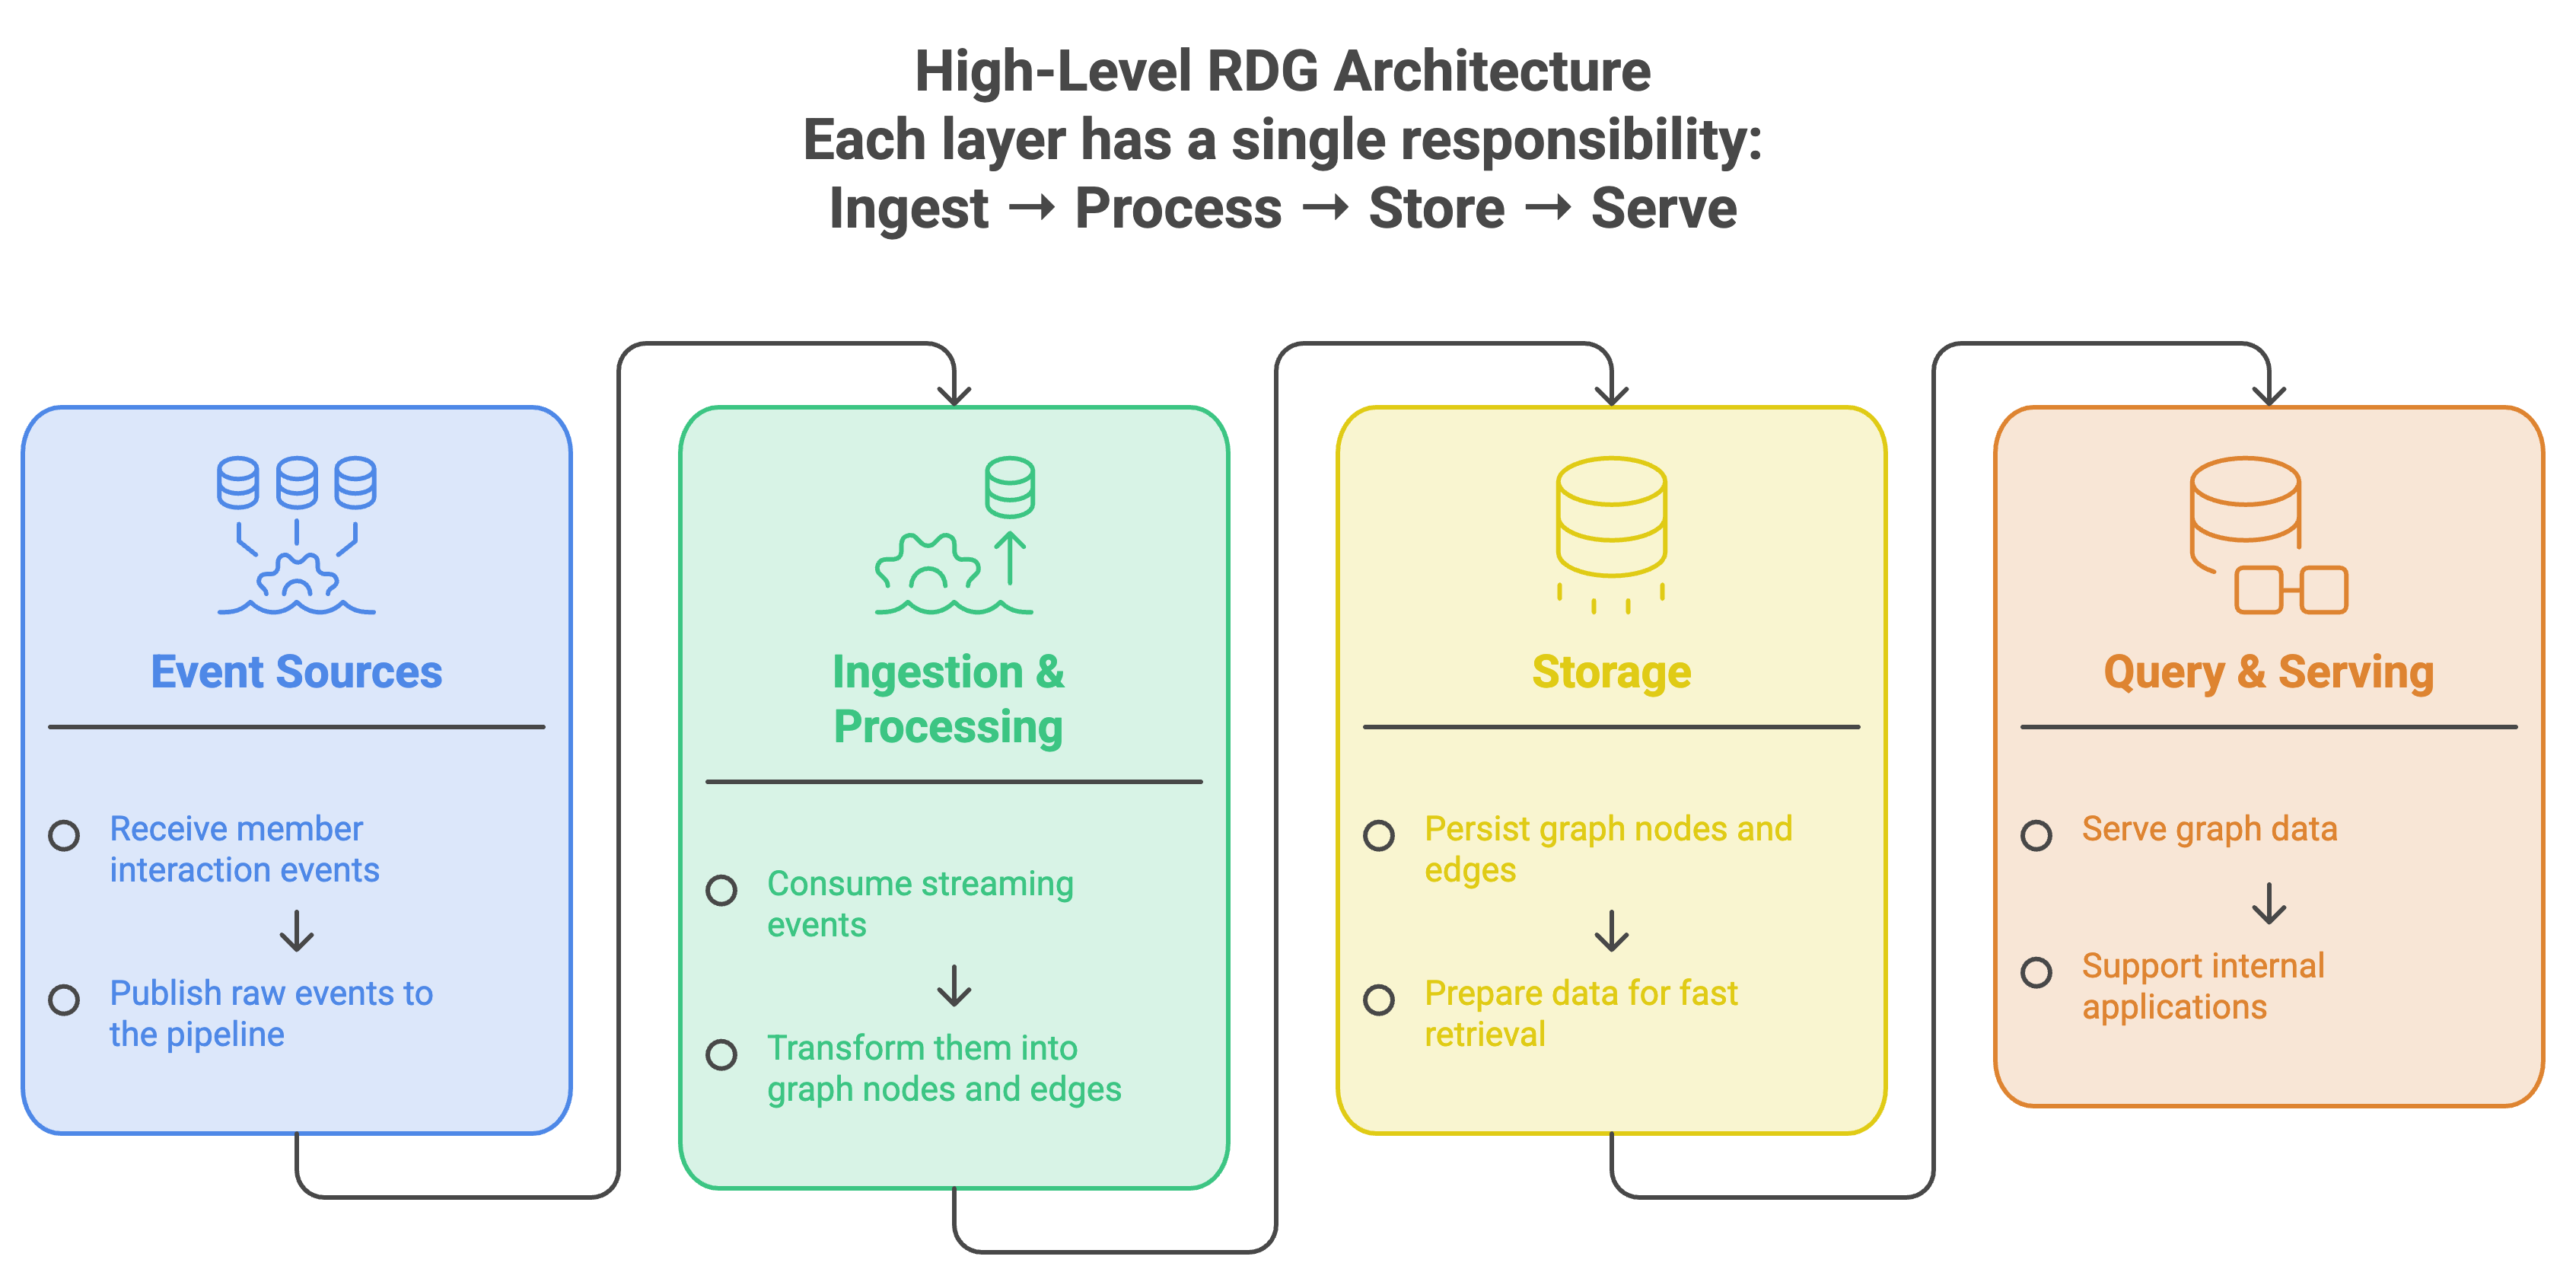
Building the graph involves much more than simply storing data. Netflix divided the system into three major layers.
Ingestion and Processing: receives events from multiple upstream systems and converts them into graph nodes and edges.
Storage: persists those nodes and edges.
Serving: allows internal applications to query the graph.

This blog focuses on the first layer, how Netflix continuously processes incoming events and transforms them into graph data.
Why Netflix Chose Stream Processing
The Real-Time Distributed Graph is designed to stay continuously up to date. Every new member interaction should quickly become part of the graph. Traditional batch processing systems weren't designed for this kind of workload because they process data periodically rather than continuously.
Instead, Netflix adopted a stream processing architecture. As events arrive, they're immediately processed and used to update the graph. This minimizes delay and allows the graph to reflect the latest member activity with very low latency.
But before those events can be processed, they first need a reliable way to enter the system. That's where Apache Kafka becomes the foundation of Netflix's ingestion pipeline.
In Case you are not aware of Kafka, please refer our older blog on Kafka: What is Kafka?
Kafka: The Entry Point for Every Event
Whenever a member performs an action in the Netflix app, the event is first sent through Netflix's API Gateway. From there, the event is written to Apache Kafka topics. Rather than acting as permanent storage, Kafka serves as the central ingestion backbone that makes these events available to downstream applications.
One of its biggest advantages is that it provides durable and replayable event streams. This allows processing systems to consume events in real time while also replaying them whenever historical data needs to be processed again.
Netflix's RDG platform consumes data from several Kafka topics, with each topic handling up to roughly one million messages per second. The events are encoded using Apache Avro, while their schemas are maintained in a centralized schema registry. To balance storage cost with data availability, Netflix configures different retention policies for different Kafka topics based on their throughput and record size.
Since Kafka doesn't retain data forever, Netflix also stores these records in Apache Iceberg tables. This makes it possible to backfill older data whenever it is no longer available in Kafka.
At this point, the events have entered the pipeline.
Processing Millions of Events with Apache Flink
Once member events are available in Kafka, the next challenge is transforming them into a graph that can be updated in real time.
For this, Netflix uses Apache Flink, a stream processing framework designed for processing continuous streams of data with very low latency. According to the blog, Flink was chosen not only because of its strong real-time processing capabilities but also because it integrates seamlessly with Kafka and Netflix's internal storage platforms.
Every RDG Flink job follows a series of processing steps.
First, it consumes events from one or more Kafka topics.
The events are then passed through several processor functions, each responsible for preparing the data before it becomes part of the graph.
The processors:
Filter unnecessary or incomplete events.
Enrich events with additional metadata using side inputs.
Transform events into graph primitives nodes, representing entities such as members or titles, and edges, representing the relationships between them.
Buffer and deduplicate repeated updates within a configurable time window to reduce downstream traffic.
Finally, publish the processed nodes and edges to Data Mesh, which persists them to the storage systems used by other internal services.
Although a simple example may produce only a few nodes and edges, the actual system can generate dozens of nodes and relationships from a single member interaction, depending on the event being processed.

By the time an event leaves the Flink pipeline, it has been converted from a raw application event into structured graph data that downstream services can query.
Why One Flink Job Didn't Scale
At first, Netflix tried to keep the architecture simple. The initial design used a single Flink job to consume all Kafka topics. On paper, this seemed like an easy way to process every incoming event through one centralized pipeline. In practice, however, it quickly became difficult to operate.
Different Kafka topics produce very different traffic patterns. Some generate significantly more events than others, and their throughput changes throughout the day. This made it extremely difficult to find a single configuration for CPU, memory, job parallelism, and checkpoint intervals that worked well for every workload.
Instead of continuing with one large processing job, Netflix changed its approach. The team adopted a 1:1 mapping, where every Kafka source topic is processed by its own dedicated Flink job.
This increased the number of jobs that engineers needed to develop and deploy, but each job became much easier to understand, tune, and maintain. Since every workload could now be configured independently, operational complexity was significantly reduced.
Separating Graph Data for Better Scalability
Netflix applied a similar principle to graph data itself. Rather than writing every node and edge into a single Kafka topic, each node type and edge type is written to its own dedicated topic.
This naturally increased the number of Kafka topics the platform needed to manage. However, it also gave Netflix much greater flexibility.
Different graph entities could now be scaled, tuned, and managed independently based on their own traffic patterns instead of sharing one common configuration.
The team also designed the graph model to remain as generic and flexible as possible, making the addition of new node or edge types an infrequent operation rather than a major architectural change.
Why This Architecture Matters
Although this blog focuses only on the ingestion and processing layer, it highlights an important engineering principle.
Building a real-time graph isn't simply about storing relationships.
The harder challenge is continuously transforming millions of events into connected graph data while keeping the system scalable, reliable, and easy to operate.
Netflix addressed this by combining:
Kafka for durable, replayable event ingestion.
Apache Flink for real-time stream processing.
Data Mesh for publishing processed graph data to downstream storage systems.
Together, these components form the first stage of Netflix's Real-Time Distributed Graph, ensuring member interactions across devices and products can be connected almost as soon as they happen.
The next part of Netflix's engineering series explores how these graph nodes and edges are stored and served efficiently once they've been created.
Key Takeaways
Netflix built the Real-Time Distributed Graph (RDG) to connect member interactions across different products and devices in near real time.
Traditional data warehouses couldn't provide the low-latency relationship discovery required for these use cases.
Kafka serves as the ingestion backbone, while Apache Flink processes continuous event streams into graph nodes and edges.
Instead of using one large Flink job, Netflix adopted a 1:1 mapping between Kafka topics and Flink jobs, making the system easier to scale and operate.
Separating different node and edge types into dedicated Kafka topics gave Netflix greater flexibility to tune and scale individual workloads independently.
Official blog from Netflix: How and Why Netflix Built a Real-Time Distributed Graph: Ingesting and Processing Data Streams at Internet Scale
By now, you must have had a clear idea of, How Netflix Built a Real-Time Distributed Graph to Connect Billions of Member Interactions? In a nutshell, Netflix built a Real-Time Distributed Graph that continuously transforms millions of streaming events into connected graph data, enabling real-time relationship analysis across members, devices, and products.
Congratulations! You've just advanced another step in your tech journey. Keep progressing!