How Uber Standardized Mobile Analytics (Without Slowing Down Teams)
Uber standardized mobile analytics by moving event logic to the platform, automating metadata, and ensuring consistent, reliable data across apps.
When you use an app like Uber, every interaction matters. A tap, a scroll, a screen view, all of these generate signals that help teams understand:
What users are doing
Where they’re facing friction
Which features are actually working
This is what powers product decisions, A/B experimentation, ML-driven recommendations and personalization. But collecting this data at scale? That’s where things get complicated. Let’s discover what Uber did in this blog today.
How Mobile Analytics Works (At a High Level)
Before diving into the problem, let’s quickly understand how analytics works inside Uber.

Source:How Uber Standardized Mobile Analytics for Cross-Platform Insights
Don’t worry if the above diagram looks too much for now, let me simplify it for you.
So, Whenever a user interacts with the app:
Engineers define an event (along with metadata)
It’s added to the UI component
The event gets triggered when the user interacts
It’s batched and sent to backend systems
Teams use this data for insights
This pipeline is critical for Monitoring feature health, Understanding user journeys and Powering ML-driven recommendations. So far, everything sounds clean. But systems don’t fail at small scale, they fail when multiple teams start building on top of them.
Where Things Started Breaking
Even though Uber had a structured system, things didn’t scale well. But what was the core issue? Every team handled analytics differently. The biggest issue wasn’t the pipeline. It was how teams were using it.

Each team:
Defined events differently
Logged data in their own way
Added metadata manually
Created custom events for everything
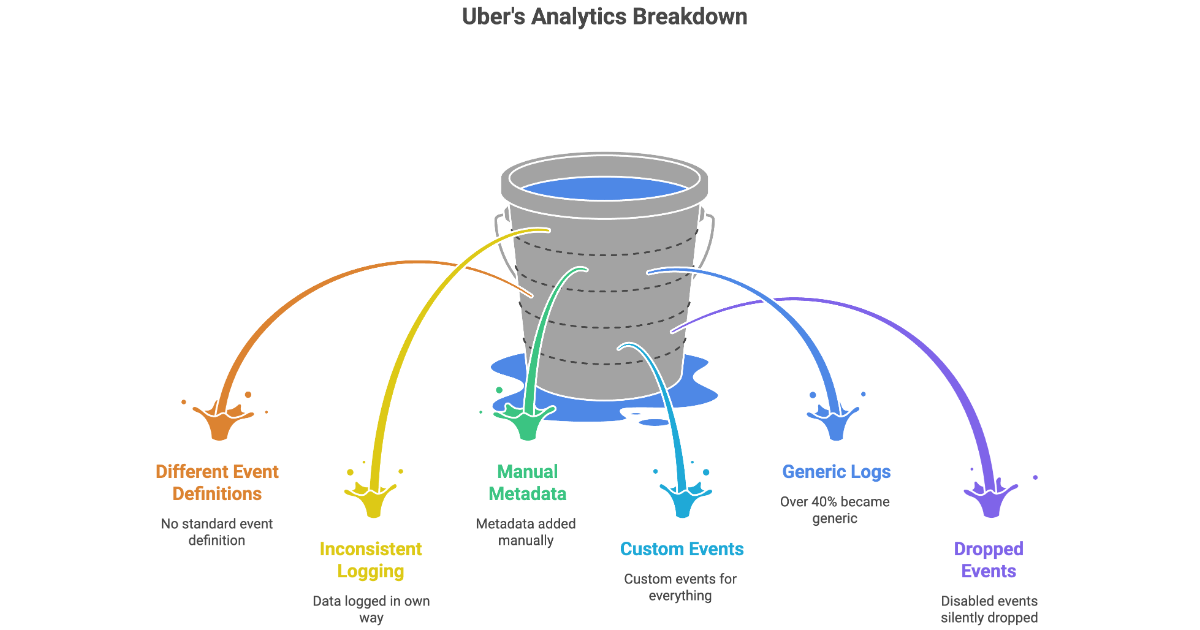
Over time, this created chaos:
No standard definition of events
Missing analytics in shared UI components
Duplicate and inconsistent metadata
Over 40% of events became generic “custom logs”
Disabled events were silently dropped
Now think about the impact. If data is inconsistent then insights become unreliable and if insights are unreliable then decisions become risky. This wasn’t just a data problem. It was a product and business problem.
The Key Insight: The Platform Should Own Analytics
Uber realized something very important:
If every team defines analytics differently, the system will never be consistent. As long as analytics is owned by feature teams, consistency is impossible.
Because every team optimizes for speed, No one optimizes for global consistency.
So they made a bold shift to move analytics logic from feature teams into the platform. This changed the model completely:
Before, teams decided how to log events. Now, the platform defines the rules and teams just use them.
Engineers no longer decide “how to log”
They just use standardized tools
Step 1: Standardizing Events Across the App
Uber started by standardizing the most common user interactions. The first step was to define clear event types. They started with three core events and introduced clear definitions for:
Tap: when a user interacts with a UI element
Impression: when ≥50% of a view is visible for 500ms
Scroll: when scrolling starts and stops
This might sound simple but it’s huge because earlier each team had its own definition of “impression”. Now, one definition across the entire system.
Step 2: Separating Analytics from UI Logic
Another major improvement was introducing AnalyticsBuilder. Instead of mixing analytics inside UI code:
AnalyticsBuilder handles when events should fire
UI components focus only on rendering
It tracks lifecycle events like View appearing and View disappearing and decides when to trigger analytics events. This makes the system more reusable, testable and consistent.
Step 3: Moving Analytics Into UI Components
Earlier Engineers manually added analytics to each feature. Now Uber instrumented 50+ common UI components. So things like Buttons, Lists and Views automatically emit analytics events.
This means, Engineers don’t need to “remember” analytics anymore. Analytics becomes default behavior, not manual effort.
Step 4: Standardizing Metadata (The Hidden Problem)
Another major issue was metadata inconsistency.
Different teams:
Logged the same data differently
Used different naming conventions
Repeated the same values
Uber fixed this by introducing two layers of metadata.
1. App-Level Metadata
Data common to the entire app (like location or restaurant ID) is defined once and automatically attached to every event.
2. Event-Level Metadata
Things like scroll direction, list index and view position are automatically captured by the system.
Standardizing UI Surfaces
Every UI component is also categorized:
Buttons → BUTTON
Containers → CONTAINER_VIEW
Sliders → SLIDER
This ensures that every event clearly indicates where it came from.
Step 5: Preventing Data Loss with Sampling
Earlier, if an event was disabled or unmapped, it was completely dropped which meant losing data forever.
Uber fixed this by introducing sampling, 0.1% of sessions log all events even disabled or unmapped ones.
This creates a safety net so you never fully lose visibility into your data.
Step 6: Testing Before Full Rollout
Before scaling, Uber ran a pilot.
They:
Ran old and new systems in parallel
Logged events using both old and new systems
Compared outputs
Validated consistency and correctness
They checked event volume, metadata accuracy and behavioural correctness.
This helped uncover:
Differences between iOS and Android
Opportunities to simplify event structures
Step 7: Scaling Across the Organization
Once validated, Uber rolled it out in two ways:
Central Migration: Platform team replaced old APIs directly
Distributed Migration
Teams were supported with scripts
High-impact events were prioritized
They also added a linter to block non-standard event usage so the system stays clean going forward.
Impact: Cleaner Data, Faster Development
For Data Teams
Consistent event definitions
Reliable cross-platform analysis
More accurate metrics
Reduced noise
For example, Impression accuracy improved significantly due to stricter rules
For Engineers
Much less code to write
No manual metadata handling
Built-in analytics in UI components
Faster onboarding
What’s Next: Component-Based Analytics
Uber is now pushing this even further. They’re moving towards component-based analytics. Instead of manually defining events:
Each component gets a unique ID and automatically generates event names.
Format:
[component]_[surface]_[event]Example:
production_selection_button_tapThis reduces duplication, Improves naming consistency and simplifies tracking.
Takeaways
Uber’s biggest learning is simple: Don’t leave analytics to individual teams, build it into the platform.
By:
Standardizing events
Automating metadata
Instrumenting UI components
Preserving data through sampling
They built a system that is Scalable, Reliable and Easy to use and most importantly, one that teams can actually trust.
Official blog from Uber: How Uber Standardized Mobile Analytics for Cross-Platform Insights
By now, you must have had a clear idea of, How Uber Standardized Mobile Analytics (Without Slowing Down Teams)? In a nutshell, Uber fixed inconsistent mobile analytics by moving event logic from feature teams into the platform and standardizing events, metadata, and UI instrumentation. This ensured reliable, scalable data while reducing engineering effort and improving cross-platform insights.
Congratulations! You've just advanced another step in your tech journey. Keep progressing!
Rohit Lakhotia
Rohit Lakhotia is a software engineer and writer covering engineering, career growth, and the tech industry.